Yes, that is my logic. All the other important stats are relative to the original bet, so why not this one too.


Yes, that is my logic. All the other important stats are relative to the original bet, so why not this one too.

I looked into the default basic strategy for a 6-deck hit-17 game again and found another minor problem. The hand 9-9vs7 needs a deviation index, but the hands 9-9vs.8 and 9-9vs.9 do not need any. Right?

I looked into the default basic strategy for a 6-deck hit-17 game again and found another minor problem. The hand 9-9vs7 needs a deviation index, but the hands 9-9vs.8 and 9-9vs.9 do not need any. Right?
Right.
I also corresponded with Shack and determined why his win % is only in the low 42s and the loss is 49%. It's because that sim he did permitted surrender, and, of course, we lose ALL the hands we surrender, which is 4.45%. By definition, those hands have at least a 75% chance of losing, and most are very close to that value. So, if we were to play them out instead (no surrender offered), we'd lose 75% of 4.45% or 3.34% of the hands, and we'd win the remaining 1.11%. So now, we lower Shack's losses by 1.11% and raise his wins by that same amount, yielding the more traditional values that Phil got. (Note: pushes are usually 8.5% or so and will also increase very slightly when we hit all of the hands that we surrender, giving the possibility of a push).
Clear?
Don
Wonderful explanation! I just hope Phil add the surrender option into his powerful simulator so that I can test out these numbers.
Thank you!
Following Don’s logic, it probably makes more sense to change “# of Hands per visit 400” to “# of Rounds per visit 400” ? Anyway, this is all about definition.
I have polled my sources: Norm Wattenberger, Cacarulo, Mike Shackleford, and Gronbog. The consensus is for counting the overall dollar result of the ROUND as one single win, loss, or push, which is what I advocated above. It is, logically, in essence, simply stating whether the ORIGINAL hand led to an overall win, loss, or push and, personally, I'm fine with that interpretation.
Don
Thanks very much! Appreciate you checking with them. I will change it to record a single win, loss, or push based on the overall result of the hand.
Phil
I looked into the default basic strategy for a 6-deck hit-17 game again and found another minor problem. The hand 9-9vs7 needs a deviation index, but the hands 9-9vs.8 and 9-9vs.9 do not need any. Right?
Right.
I also corresponded with Shack and determined why his win % is only in the low 42s and the loss is 49%. It's because that sim he did permitted surrender, and, of course, we lose ALL the hands we surrender, which is 4.45%. By definition, those hands have at least a 75% chance of losing, and most are very close to that value. So, if we were to play them out instead (no surrender offered), we'd lose 75% of 4.45% or 3.34% of the hands, and we'd win the remaining 1.11%. So now, we lower Shack's losses by 1.11% and raise his wins by that same amount, yielding the more traditional values that Phil got. (Note: pushes are usually 8.5% or so and will also increase very slightly when we hit all of the hands that we surrender, giving the possibility of a push).
Clear?
Don
Thanks very much for all of this. I will add a deviation index for 9,9 vs. 7. I am working on adding surrender as well.
Phil
Following Don’s logic, it probably makes more sense to change “# of Hands per visit 400” to “# of Rounds per visit 400” ? Anyway, this is all about definition.
I have polled my sources: Norm Wattenberger, Cacarulo, Mike Shackleford, and Gronbog. The consensus is for counting the overall dollar result of the ROUND as one single win, loss, or push, which is what I advocated above. It is, logically, in essence, simply stating whether the ORIGINAL hand led to an overall win, loss, or push and, personally, I'm fine with that interpretation.
Don
Thanks very much! Appreciate you checking with them. I will change it to record a single win, loss, or push based on the overall result of the hand.
Phil
Counting player busts as a % of hands or rounds presents a question if split hands are not counted separately, such as if there are multiple busts within a split. Or other events within split hands. I guess one can have multiple busts or other events per hand in this case.
I may just add % wins, losses, pushes as % of initial hands (counting split hands as 1 hand) to the results. And clarify what my other %s are and possibly eventually changing the method.
I may just add % wins, losses, pushes as % of initial hands (counting split hands as 1 hand) to the results. And clarify what my other %s are and possibly eventually changing the method.
That would be fine. Truth be told, as you must understand, this is, more or less, a somewhat useless statistic that really isn't used for anything meaningful.
Don
I've tested this simulator a little more to find out the EV contributions from different HiLo deviation indices. To do this, I fixed the betting spread to be 1-16 for the TC range of 0-5.
For the insurance index of TC=+3, I found that insurance adds a ~10% profit on top of the basic strategy value. This is easy to do because the simulator has singled out all these insurance hands.
For the 16vs.10 hit/stand index of TC=+0, I could not find such a value though. The profit from this index was entangled into other profits, so it was hard to find a consistent value. Actually, in several of my simulations, this index actually made the profit less.
Book coming! All these questions answered, and thousands more. 😀
Don
I may just add % wins, losses, pushes as % of initial hands (counting split hands as 1 hand) to the results. And clarify what my other %s are and possibly eventually changing the method.
That would be fine. Truth be told, as you must understand, this is, more or less, a somewhat useless statistic that really isn't used for anything meaningful.
Don
Thanks, yes, it's the money %'s that really count, lol.
Phil
I've tested this simulator a little more to find out the EV contributions from different HiLo deviation indices. To do this, I fixed the betting spread to be 1-16 for the TC range of 0-5.
For the insurance index of TC=+3, I found that insurance adds a ~10% profit on top of the basic strategy value. This is easy to do because the simulator has singled out all these insurance hands.
For the 16vs.10 hit/stand index of TC=+0, I could not find such a value though. The profit from this index was entangled into other profits, so it was hard to find a consistent value. Actually, in several of my simulations, this index actually made the profit less.
In my runs I think I found that 16 v. 10 deviation at 0 or at -1 or +1 was helping % amount won a little. Will have to try this again. But I was running with 2 decks, about 70% penetration, and a fairly low bet spread of $25 to $60 or sometimes $75. The simulator doesn't do anything with hand composition, so maybe there are some multi card hands that maybe the strategy could be a little better.
(was using Zen count)
Upon further inspection, I come with more minor revisions to your basic strategy table. You need to add a deviation index for these hands: 4,4vs4; A,5vs3; A,9vs4, A,9vs5, A,9vs6, because they are frequently used. Also, you need to remove a lot of useless indices because card counting is based on basic strategy. I have made a table on the hard-total hands to show you which ones to remove.
The red zone is safe Stand.
The green zone is safe Hit.
The blue zone is safe Double.
The pink zone is the Hit/Stand zone but also the Surrender zone.
In these safe zones, you do not need a deviation index mostly.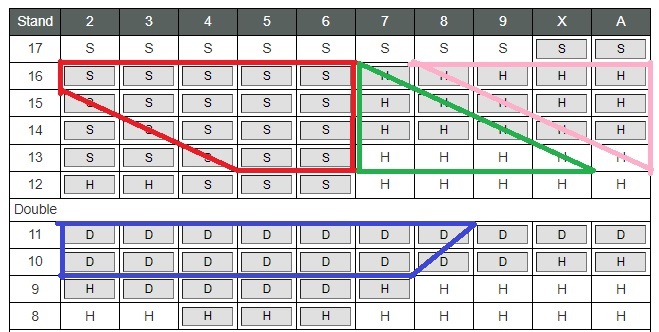
Another thing, I urge you to switch to HiLo so that we can better compare the results. I've never used Zen, but I am very sure it is not effective for double decks.
I've tested this simulator a little more to find out the EV contributions from different HiLo deviation indices. To do this, I fixed the betting spread to be 1-16 for the TC range of 0-5.
For the insurance index of TC=+3, I found that insurance adds a ~10% profit on top of the basic strategy value. This is easy to do because the simulator has singled out all these insurance hands.
For the 16vs.10 hit/stand index of TC=+0, I could not find such a value though. The profit from this index was entangled into other profits, so it was hard to find a consistent value. Actually, in several of my simulations, this index actually made the profit less.
I also investigated this matter a little more and found some new results.
The insurance index of TC=+3 adds a 23% profit on top of the basic strategy value. This corresponds to an EV gain of +0.05%.
The 16vs10 hit/stand index of TC=+0 adds a 62% profit on top of the basic strategy value. This corresponds to an EV gain of +0.16%.
This means that the 16vs10 index is 3 times more important than the insurance index; however, this value is based on a 6-deck h-17 game using a 1-16 bet spread for the TC range of 0-5.
Let me say this as politely as possible. Just stop what you're doing, because you have absolutely no idea what you're talking about.
Don
Upon further inspection, I come with more minor revisions to your basic strategy table. You need to add a deviation index for these hands: 4,4vs4; A,5vs3; A,9vs4, A,9vs5, A,9vs6, because they are frequently used. Also, you need to remove a lot of useless indices because card counting is based on basic strategy. I have made a table on the hard-total hands to show you which ones to remove.
The red zone is safe Stand.
The green zone is safe Hit.
The blue zone is safe Double.
The pink zone is the Hit/Stand zone but also the Surrender zone.
In these safe zones, you do not need a deviation index mostly.
Another thing, I urge you to switch to HiLo so that we can better compare the results. I've never used Zen, but I am very sure it is not effective for double decks.
Thanks, yes, I can add these. I may not remove many, they are optional, will look at it.
Phil

This is page 4.
I haven't read one single page on what COULD be a GREAT thread, BUT.... as soon as I see "Aceside" in the thread.... I am gone :-(
This guy by himself is taking all my fun out of reading any BJ site.
I've tested this simulator a little more to find out the EV contributions from different HiLo deviation indices. To do this, I fixed the betting spread to be 1-16 for the TC range of 0-5.
For the insurance index of TC=+3, I found that insurance adds a ~10% profit on top of the basic strategy value. This is easy to do because the simulator has singled out all these insurance hands.
For the 16vs.10 hit/stand index of TC=+0, I could not find such a value though. The profit from this index was entangled into other profits, so it was hard to find a consistent value. Actually, in several of my simulations, this index actually made the profit less.
I also investigated this matter a little more and found some new results.
The insurance index of TC=+3 adds a 23% profit on top of the basic strategy value. This corresponds to an EV gain of +0.05%.
The 16vs10 hit/stand index of TC=+0 adds a 62% profit on top of the basic strategy value. This corresponds to an EV gain of +0.16%.
This means that the 16vs10 index is 3 times more important than the insurance index; however, this value is based on a 6-deck h-17 game using a 1-16 bet spread for the TC range of 0-5.
Let me say this as politely as possible. Just stop what you're doing, because you have absolutely no idea what you're talking about.
Don
I knew you would say this. The numbers are all from the simulator. It is what it is. The only thing I am not sure is whether the methodology I used is correct or not. You are the definite authority on this and your new book is coming soon. What does your new book say?
In fact, it is hard to obtain a consistent EV contribution from the 16vs10 hit/stand index at TC=+0 using this simulator. The value just varies a lot from different simulations. Furthermore, there is another very important EV contribution from the 16vs10 hit/surrender index at TC=-3; however, this part of simulation is missing for now. Phil is doing a great work to add this option!

