


Professional Video Poker by Stanford Wong chapter 1
PREFACE | CHAPTER 1 | CHAPTER 2 | CHAPTER 3 | CHAPTER 4
(Professional Video Poker by Stanford Wong was written quite some time ago, and is now out of print. It contains some information that is no longer current. It is reprinted here in its entirety as a historical reference and a reminder of how video poker used to be. Current video poker products are available through our online catalog.)
Chapter 1 - Win Rates
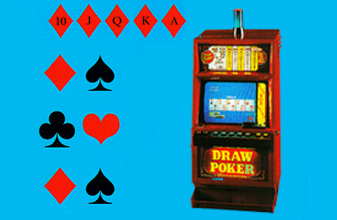
Video-poker slot machines have been proliferating. The most common are draw poker using one 52card deck with a shuffle after every hand. First you insert your bet; then you are dealt five random cards. You decide which, if any, of the five you want to keep.
For the cards you discard, you are dealt random replacements from the remaining 47 cards. Then your hand is evaluated, with the different possible poker hands winning specified numbers of coins.
Since you decide which cards to keep out of your first five, there is skill involved. The proper way to play some video-poker hands is different from the way you would play those same hands in a regular poker game. In video poker you are simply trying to get certain card combinations; you are not trying to beat anyone else’s hand.
There is such a thing as proper playing strategy for video poker. You are dealt five cards, and whether you hold or discard each one is up to you. For a given set of payoffs, one play is best in the sense of making more money on average than the other possible ways to play the hand.
Different payoffs for the various final hands mean differences in proper playing strategy. This book presents playing strategies that change with the size of the jackpot rather than being fixed. The changes involve making more draws to try for a royal flush as the payoff for a royal flush increases.
Different playing strategies yield different frequencies of final hands. Precise frequencies of final hands can be calculated if a particular playing strategy is specified. Table 1 contains a payoff schedule that has a slight edge for the player who plays perfectly. The payoff is expressed as a ratio of coins returned to coins bet. For example, the royal flush at 1000 can mean 5000 coins returned on a bet of five coins.
Table 1 also contains frequencies of the various final video poker hands, assuming perfect play. The frequencies are in percent; for example the frequency of a royal is 0.0028%, which is the same thing as 0.000028.
These frequencies were calculated by VPEXACT, a computer program I wrote for IBM PCs.
One thing of interest in table 1 is the similarity of the frequencies of full house, flush, and straight. Each is approximately 1.1%.
A customer who uses perfect playing strategy has a payback of 100.07%, which means an edge of 0.07% over the casino for the payoff schedule of table 1. The break-even royal-flush jackpot for perfect play on 9-6 machines is 976 coins. Some Nevada casinos have “flattops,” i.e. non-progressive machines, that have the payoff schedule shown in table 1. The casinos make money on those machines only because of customer mistakes.
You ought to play some hands differently as the jackpot increases. Each strategy change is accompanied by a slight increase in the probability of hitting a royal flush, and also a slight increase in the per-hour loss rate while waiting for a royal flush.
On average, a royal flush occurs once per 30,000 to 50,000 hands, depending on how aggressively you try for a royal. This assumes each card remaining in the deck is equally likely to be drawn, and each combination of cards is equally likely. (If you try for royals only, you should get one per 21,745 hands.)
The technology exists to make some cards more likely to be drawn than other cards, or to make some combinations of cards more likely than other combinations. For example, then you draw one card to four of a royal flush, the machine could be set to give you the card you need with less than the proper frequency of 1/47. In my opinion this would be cheating. So far as I know this has not yet occurred in the legal casinos of Nevada or Atlantic City. However, some professional video poker players are less confident about some overseas video poker games. If you are playing video poker against machines that promise a generous payoff percentage but seem to take everyone’s money too quickly, save your quarters for a trip to Las Vegas.
You can use table 1 to estimate the casino edge on machines with payoff schedules that differ from it in only minor ways. The most common differences are in the payoffs for royal flush, full house, and flush. Each 1-coin change in the per-coin payoff for full house or flush means about 1.1%. Each 1000-coin change in the per-coin royal-flush payoff means about 3%; thus on those stretches in which you play these machines without hitting a royal flush, you lose about 3% faster than average.
Chapter 2 covers machines that pay 8 for a full house and 5 for a flush. That is one bet less for a full house and one bet less for a flush than the payoff schedule of table 1. Since full house and flush each occur about 1.1% of the time, 8-5 machines have a 2.2% greater house edge than otherwise-identical 9-6 machines.
The hand frequencies in table 2 apply to the playing strategy appropriate for a royal-flush payoff of 3200 coins per coin bet. (On a quarter machine with five coins played, this is a jackpot of $4000.) The payoff schedule being different from table 1 means you play some hands differently, and this means slightly different frequencies of final hands from table 1. A player using perfect strategy has an edge of 4.6% for the payoff schedule of table 2.
The actual break-even jackpot size for a progressive jackpot on the 8-5 quarter machines analyzed in chapter 2 is 1733 bets for perfect play, or 1752 bets for the usable strategy presented herein. At $1.25 per pull of the handle, 1752 bets is $2190, which rounds to $2200. This is the point at which if you played forever, coins fed in would approximately equal payoffs received. At jackpots higher than $2200, you have an edge.
Your expected loss per hour while waiting for a royal flush depends on the level of the jackpot. At the break-even point it is 5.4%, and it increases as the jackpot increases and you change strategy to try harder for a royal. At a jackpot of 3200 ($4000 for five quarters), the loss rate between royal flushes is 5.6%.
Tables 3 through 11 contain some of the more common payout schedules found in Nevada and Atlantic City, and the frequencies of the various hands if the machines are played using perfect strategy.
Many Atlantic City flat-tops have the payoff schedule of table 9. This schedule differs from table 1 by paying 800 for a royal flush, 6 for a full house, and 5 for a flush. Lowering the payment on the royal flush by 200 gives the casino 0.5%. Lowering the payment on a full house by 3 gives the casino another 3.4%. Lowering the payment on a flush by 1 gives the casino another 1.1%. You are expected to lose at the rate of 5.0% if you are so foolish as to play these Atlantic City flat-tops; and you must play them perfectly to lose at only 5.0%.
Atlantic City also has progressives that pay 6 for a full house and 5 for a flush; strategy for these machines is presented in chapter 4.
Rate of Play
How fast you play depends on how much practice you get, how coordinated you are, and what kind of machine you are playing. Credit machines are faster than machines into which you must hand-feed five coins each play.
500 hands an hour is a reasonable rate to use for planning purposes. The pros play faster than that. With practice you too probably will play faster than 500 hands per hour. I do not know the upper limit; people have written to me that they have clocked 800 hands per hour.
If you play 500 hands per hour, which is not difficult, you should average one royal flush per 62 hours of video poker. This is a long-run average; it does not mean one royal flush in every 62 hours of play. You might hit two royal flushes on the same day or you might play for hundreds of hours without hitting a single royal.
Marginal Win Rate
500 hands an hour on a quarter machine means feeding the machine $625 per hour. On dollar machines you feed in $2500 an hour.
There is a very important thing to realize about video poker: Your expected result is to lose steadily between royal flushes. This is true whether you are playing with an edge or not. If you are playing a break-even situation, your wins on royal flushes should, in the long run, exactly cover your losses between hitting royals. If you are playing with an edge, you still are expected to lose between royals, but your wins on royals should more than cover your losses between royals.
There is no video poker system that makes you a winner without hitting a royal. Between royals, your expectation is to lose, period. This book does, however, help you cut your losses between royals as much as possible. Someone who plays video poker poorly is expected to lose more money between royals.
On the 8-5 quarter machines common in Nevada, a reasonable estimate of the loss rate while waiting for a royal flush is $35 an hour. In the 6-5 quarter machines common in Atlantic City, a reasonable estimate of the loss rate while waiting for a royal flush is $50 an hour. Each $1000 in the jackpot is worth about 2.5%, or $16 an hour.
For 8-5 dollar machines into which you must insert five dollars to be eligible for the jackpot, the break-even point is a jackpot of about $8800 and each additional $1000 in the jackpot adds about 0.64% to your expected win rate. Playing 500 hands an hour on the dollar machine means betting $2500 an hour, and 0.64% of that is $16 per hour.
Thus each $1000 of the royal-flush payoff adds the same $16 an hour to your expected hourly win rate whether you are playing 8-5 progressives, 6-5 progressives, or some other payoff schedule, and whether you are playing for quarters, dollars, or some other denomination. Of course jackpots on dollar machines sometimes rise many thousands of dollars above the break-even point, whereas jackpots on quarter machines seldom rise above $5000.
On 8-5 dollar machines, you probably will lose at a rate of about $140 an hour while trying for the royal. On 6-5 dollar machines, the waiting loss rate is about $200 an hour.
To figure out your expected win per hour, just follow the above examples. First, figure out how fast you are expected to lose per hour while waiting for a royal flush. Then divide the jackpot by 1000 and multiply by 16 to get the value per hour of the jackpot. The amount by which the latter exceeds the former is your expected win per hour.
Here is an example. In July of 1988 in the Westward Ho casino in Las Vegas, I saw a bank of 8-5 quarter machines with a progressive jackpot of just over $2850. There were 24 slot machines connected to that jackpot, and I was surprised to see that not a single one of those machines was in use on the afternoon of my visit! The value of the jackpot was 2.85 times $16, or more than $45 an hour; and I would have lost at the rate of $35 an hour before hitting it. The net is my time would have been worth more than $10 an hour had I stopped to play those machines.
Another way to do the calculation of expected win per hour is to subtract the break-even jackpot from the actual jackpot, divide by 1000, and multiply by 16.
For example, playing a quarter machine with a jackpot of $2850, which is $650 above break-even, means expecting to win 0.65 times $16 or more than $10 per hour.
Risk While Waiting For a Royal Flush
The biggest component of the risk is royal flushes; your outcome is dominated by the number of them that you receive. The next biggest component is fours-of-a-kind; how many of them you get is the next most important factor in explaining how your actual result differs from your expected result.
The most common expression of risk is standard deviation. Let us start by ignoring royal flushes. For the 8-5 machines discussed in chapter 2, the standard deviation is about 1.82 bets per play while waiting for a royal flush. For the 6-5 machines common in Atlantic City, the single-pull standard deviation is about 1.74 bets.
To find the standard deviation for more than one pull of the handle, multiply the single-pull standard deviation by the square root of the number of pulls you want. For example, one hour means 500 pulls of the handle, and the square root of 500 is 22.4. On 8-5 machines the standard deviation for one hour of play without royal flushes is about 41 bets, or about $51 for quarter machines. For 6-5 machines, the standard deviation for one hour of play without royals is about 39 bets, or about $49 for quarter machines.
In summary, on quarter 8-5 progressive video-poker machines you are expected to lose at the rate of about $35 an hour while waiting for a royal flush, and the standard deviation applicable to that number is $51. On quarter 6-5 progressive video-poker machines, you are expected to lose at the rate of about $50 an hour while waiting for a royal flush, and the standard deviation on that number is $49. Expected loss goes up with the number of hours, and standard deviation goes up with the square root of the number of hours.
Overall Risk
By far the most important component of overall risk is the payoff for a royal flush. So dominant is it that you can ignore everything else except the number of plays. That is, the overall standard deviation depends on the size of the royal-flush jackpot only, and not on the payoffs for other hands and not on the denomination of coins used.
The overall standard deviation for one pull of the handle is approximately equal to the jackpot times the square root of the probability of hitting it. Thus the overall standard deviation for one pull is equal to about 0.57% of the jackpot. For example, if the jackpot is $4000, the overall standard deviation on one pull of the handle is about $23.
To express overall standard deviation as dollars for an hour of play, multiply the per-pull standard deviation by the square root of the number of pulls per hour. Thus the overall standard deviation on one hour of 500 pulls is about 12.65% of the jackpot. For a jackpot of $4000, the overall standard deviation is about 12.65% of $4000, or $506 per hour.
When you play for quarters, you might find jackpots of $4000 or so, but seldom will you encounter a jackpot above $5000. So $500 seems like a reasonable estimate of the overall standard deviation for an hour’s play on quarter machines. For longer plays, the standard deviation applicable to your winnings on quarter machines is about $500 times the square root of the number of hours you play. After 1000 hours of quarter play for jackpots of $4000 and up, the standard deviation applicable to your total win is around $16,000. Jackpots of $4000 and up mean an expected hourly win rate of $30 or so. So after 1000 hours of quarter video poker with jackpots of $4000 and up, your total expected win is about $30,000 and the standard deviation on that number is about $16,000.
The numbers in the above paragraph suggest that playing video poker is almost as risky as playing blackjack. A bankroll of about $10,000 is appropriate for trying to make a living playing quarter video poker. For machines requiring five dollars, your bankroll ought to be four times as high.
The size of the jackpot at any instant can be used to find the win rate at that instant. But for a progressive jackpot, that is not the same thing as the average you can expect to make per hour if you play until the jackpot is hit. On average you will make more than the instantaneous win rate, because if nobody hits a max-coin royal flush right now, the jackpot will increase.
Which reminds me: Always play the maximum coins. No matter how large the five-coin jackpot gets, you cannot win it if you insert only four coins. One time when I was trying to win a $5000+ jackpot on one of the quarter machines in the northwest corner of Harrah’s Tahoe, the woman next to me groaned, “I think I made a mistake.” I looked over to see that she had a four-coin royal flush. Knowing that she had been playing the full five coins hand after hand for many hours, I asked her how she had made such a mistake. She answered that her husband advised her to quickly push the “deal” button rather than wait for the machine to deal automatically. That would be harmless except that sometimes a coin would fall through to the tray instead of staying in the machine. When that happened, she played for four coins instead of five. I was unable to convince her that her husband had given her bad advice.
Meanwhile, back to the topic. To figure out your average win rate from this instant until the jackpot is hit, you need to know how fast the jackpot increases. Some machines, such as the ones mentioned in the above paragraph, are set to have the jackpot increase by a penny for each two quarters played. A penny per fifty cents is 2%. That is the most generous I have seen, but I have been told that years ago some machines were set to have the jackpot increase by 4% of the amount played. More common nowadays is to find 1% machines — the jackpot increases by a penny for each four quarters played. Not all machines are that generous. Some increase at a miserly penny per eight quarters (0.5%) or worse.
A recent development at some casinos is for jackpots to increase by one amount until reaching a particular level, and thereafter increasing by a smaller amount.
If you are the only person playing the machines, you can count how many coins you have to put in between increases in the jackpot. If several people are playing, you can estimate how fast coins are being inserted and how fast the jackpot is rising. For example, if there are an average of eight machines in use by people playing about 500 hands an hour each, the bank of machines is getting about $5000 of play per hour; if those machines are set to increase the jackpot by 1% of play, the jackpot will increase by about $50 an hour.
On average, the jackpot will last for another 32,000 or so plays. On quarter machines that means another $40,000 or so of coins inserted. Thus the jackpot on a 1% machine will on average be hit at $400 higher than it is right now. On 0.5% machines, the jackpot will be hit at an average of $200 higher than it is right now. On 2% machines, the jackpot will be hit at an average of $800 higher than it is right now.
To find your expected average win from now until the jackpot is hit, simply add the average increase to the present jackpot. Suppose you play 500 hands an hour so each additional $1000 of jackpot is worth an additional $16 per hour to you. If you are playing a 1% machine with its $400 average increase in the jackpot, your expected average win per hour from now until the jackpot is hit is $6.40 higher than your instantaneous expected win per hour. For example, suppose the jackpot right now is $3200. That is $1000 above the break-even point, so you figure your time is worth $16 an hour right now. If the increment is 1% and you stay until the jackpot is hit, your expected average win per hour is about $22.40.
If you are lucky enough to find a 2% machine, your average expected win per hour is $12.80 higher than your instantaneous rate.
On machines into which you must insert five dollars to be eligible for the jackpot, the numbers are four times as high. For example, the expected average win per hour on a 1% dollar machine is $25.60 per hour higher than the instantaneous rate.
Chapter 2 presents a usable strategy for the most common beatable video-poker machines in Nevada. Chapter 3 presents the details from which the material in chapter 2 is derived. Chapter 4 presents a usable strategy for the most common beatable machines in Atlantic City, and a usable strategy for progressive machines paying on a pair of 10s. Chapter 4 also covers video-poker tournaments, double jackpots, bonuses for certain royal flushes, double-down options, and the second-chance option.

Please log in or register to leave a comment